Respiratory muscle endurance training improves breathing pattern in triathletes

Annals of Sports Medicine and Research
*Corresponding author
Bernardi Eva, via Gramicia 35, 44100 Ferrara, Italy; Tel:
390532455829; Fax 390532705018; E-mail:
Respiratory Muscle Endurance
Submitted: 20 October 2014
Accepted: 26 November 2014
Training Improves Breathing
Published: 27 November 2014
Copyright
Pattern in Triathletes
2014 Bernardi et al.
Eva Bernardi*, Enzo Melloni, Gaia Mandolesi, Simone Uliari,
OPEN ACCESS
Giovanni Grazzi, Annalisa Cogo
Biomedical Sport Studies Center, University of Ferrara, Italy
• Normocapnic hyperpnoea• Breathing pattern• Respiratory muscle
• Exercise performance
Recent studies show that endurance training of respiratory muscle (RMET) improves
• Oxygen consumption
exercise performance and decreases ventilation (VE) during exercise.
Purpose: To evaluate the effect of RMET with normocapnic hyperpnoea
(Spirotiger®) on respiratory function, ventilatory efficiency, cycling and running performance in triathletes.
Methods: 20M triathletes (age 21-45) were randomly allocated to two groups:
RMT group (10) and control group (10). At baseline (T0) athletes underwent respiratory function tests and maximal incremental cardiopulmonary tests performed with both cycle ergometer and treadmill; the same protocol was repeated after five weeks (T1). The RMT group trained at home for five weeks for 20 min daily, seven days a week. Between T0-T1 the daily training program didn't change.
Results: In the RMT group maximal inspiratory pressure (MIP) significantly
increased (T0: 8.9±2.4, T1: 9.4±2.1 kPa; P < 0.05) and an improvement of maximum workload (T0: 389±106 T1: 429±119W; P<0.05) and speed (T0: 18.2±2.0, T1: 19.3±2.5 km·h-1; P<0.05) was found; VE/VT (tidal volume) and oxygen consumption (VO ) trend were significantly lower (2-way ANOVA, P<0.05). An inverse correlation
between MIP and VE during both running and cycling was found (running: r2 = 0.51; cycling: r2 = 0.41; P<0.05). During running, but not cycling, the change in VE was significantly correlated with the reduction in VO (r2 = 0.57; P = 0.001). VE/VO
significantly improved. No differences were found in control group in any of the tests.
Conclusion: RMET significantly increases exercise performance and ventilatory
efficiency by means of an improvement of respiratory muscle strength and breathing pattern.
that respiratory muscle fatigue induces hyperventilation which
limits exercise performance at the anaerobic threshold in both
RMET: Respiratory Muscle Endurance Training; VE: healthy subjects [2] and athletes [6].
Ventilation; MVV: Maximal Voluntary Ventilation; MIP:
Maximal Inspiratory Pressure; VT: Tidal Volume; VO :
Recently a growing number of papers have shown a positive
Consumption; RMT: Respiratory Muscle Training Group; CON:
effect of respiratory muscle training on exercise performance
Control Group; PFTs: Pulmonary Function Test; T0: Baseline;
[7,8]. Understanding the implication of respiratory muscle
T1: After 5 weeks of training; BMI: Body Mass Index; FEV
training in exercise performance, and its effect on respiratory
forced expiratory volume in the first second; VC: Vital Capacity;
muscle function and ventilatory parameters at rest and during
FVC: Forced Vital Capacity; RR: Respiratory Rate; VCO :
exercise, is becoming an important issue.
Dioxide Output; VT: Ventilatory Threshold; RC: Respiratory
One method of respiratory muscle training is voluntary
Compensation Point; SD: Standard Deviation.
isocapnic hyperponea which is an endurance training (RMET)
requiring subjects to maintain a high level of ventilation
simulating an endurance competition (low-force, high-velocity).
Exercise performance in healthy subjects can be compromised
This technique specifically increases respiratory muscle
by respiratory muscle fatigue [1-5]. Boutellier et al. demonstrated
endurance [9], maximum inspiratory pressure [10] and exercise
Cite this article: Bernardi E, Melloni E, Mandolesi G, Uliari S, Grazzi G, et al. (2014) Respiratory Muscle Endurance Training Improves Breathing Pattern in
Triathletes. Ann Sports Med Res(1): 1003.
Bernardi et al. (2014)
tolerance in many endurance sports (i.e. cycling [11], running
Exercise performance: The subjects were instructed to
[12]) both in athletes and in untrained subjects [2,13,14]. The
avoid intensive exercise for two days before the test and refrain
mechanisms for the RMET ergogenic effect are not entirely clear
from food and caffeine for at least two hours beforehand. All
[7,8]. According to some authors, this effect could be due to the
subjects were already acquainted with the protocols.
more efficient ventilatory system and to the lower ventilation for
a given exercise intensity [12,15].
Calibration of the system was performed before each test.
The environmental conditions were similar (room temperature
Another important point when analyzing the ventilatory
21-22°C, humidity 45-55%).
response to exhaustive exercise is the observation of breathing
pattern (i.e. the tidal volume change related to minute ventilation)
During each exercise test the ventilatory parameters
which can vary, not only depending on the type of exercise [16,17],
[ventilation (VE), tidal volume (VT), respiratory rate (RR)]
but also during the development of respiratory muscle fatigue. In
and gas exchange [oxygen uptake (VO ), carbon dioxide output
fact it has been shown that with induction of respiratory muscle
(VCO )] were measured breath-by-breath by a metabolic cart
fatigue, breathing pattern significantly changes with a greater
(Quark b2, Cosmed, Rome, Italy) and averaged for 15 s intervals.
increase in respiratory rate than in tidal volume [4], which is
The heart rate was continuously monitored using a Polar
related to a reduced respiratory muscle oxygenation [18].
Accurex Plus (Polar Electro, Kemple, Finland).
In the light of all this information, we reasoned that RMET
During incremental tests the peak oxygen uptake (VO peak)
could change the breathing pattern during exercise toward a
was defined as the highest value of VO achieved at the end of
reduction of respiratory rate for the same ventilation level (VE/
the test. Ventilatory threshold (VT) was calculated by using the
VT) with different results in running and cycling, due to the
V-slope method [21] and respiratory compensation point (RC)
different ventilatory impairment during exhaustive exercise in
was determined by the intersection of the two linear segments of
the two types of sports. This should therefore allow the athletes
VE vs VCO data [21].
to improve exercise capacity.
For the maximal running test, subjects warmed up on the
So our aim is to evaluate the effects of RMET on respiratory
treadmill (Excite Med, Technogym, Gambettola, FC, Italy) for 15
function, breathing pattern, ventilatory efficiency and exercise
min according to the "Conconi protocol" [22]. The test started
performance, during both cycling and running, in a group of
at 8 km·h-1 and the speed was increased by 0.3 km·h-1 every 30
amateur trained triathletes involved in both sports every day.
s until the perceived exertion was close to maximum (burning
MATERIALS AND METHODS
sensation in limb muscles and heavy breathing corresponding
to a dyspnoea Borg score of 8/10); they then started the final
acceleration: 0.5 km·h-1 every 20 s until exhaustion.
20 amateur triathletes (male, age 21-45 y) were recruited and
randomly allocated to two groups: respiratory muscle training
The maximal incremental cycling test was performed on the
(RMT) group and control (CON) group.
personal bicycle of each triathlete clamped to an electromagnetic
roller, simulating real outdoor cycling (RealAxiom, Elite, PD,
All athletes were nonasthmatic, with no evidence of other
Italy). The subjects warmed up for 30 min according to the
respiratory diseases. The anthropometric characteristics are
"Conconi protocol" [23]. The protocol consisted of time-based
summarized in (Table 1). The Ethics Committee of the University
increments in cadence: increase of 1 rpm every 30 s starting from
Hospital of Ferrara approved the study; informed consent was
60 rpm (corresponding to an increase of 6 W every 30 s starting
obtained by each subject.
Study design
Table 1: RMT and CON group characteristic before and after 5 weeks
of training.
At baseline (T0) all subjects underwent: physical evaluation,
RMT-T0 RMT-T1 CON-T0
pulmonary function tests (PFTs) and exercise tests: running and
cycling maximal incremental test. After five weeks (T1) all tests
Anthropometrics parameters: Weight and height were
Weight (kg)
Pulmonary function
Pulmonary function tests: PFTs were performed by
spirometer (Quark b2, Cosmed, Rome, Italy) according to
international guidelines [19]: forced expired volume in the first
second (FEV ), vital capacity (VC), forced vital capacity (FVC) and
12 s maximal voluntary ventilation (MVV) were measured.
FEV % pred
114 ± 9 115 ± 11 116 ± 15 113 ± 13
The maximal inspiratory pressure (MIP) was measured
6.4 ± 0.8 6.4 ± 0.8 6.0 ± 1.0 5.9 ± 0.7
with a manometer connected to a mouthpiece (Micro RPM, Care
FVC % pred
120 ± 10 120 ± 10 118 ± 12 106 ± 35
Fusion, San Diego, California, USA) according to international
MIP (kPa)
guidelines [20]; subjects repeated the manoeuvre for a minimum
of five attempts and reproducibility had to be within 5-10%. The
highest value was considered for statistical evaluation.
200 ± 34 197 ± 39§
Ann Sports Med Res 1(1): 1003 (2014)
Bernardi et al. (2014)
at 90 W) until a dyspnoea Borg score of 8/10 was reached; then
between RMT and CON at T1 shows a significant difference in
the final acceleration started (1 rpm corresponding to 9 W every
MIP improvement and in MVV (unpaired T-Test, P = 0.03 and P =
20 s) until exhaustion.
Endurance respiratory muscle training
Endurance Respiratory Muscle Training
The training protocol lasted for five weeks and was performed
According to the training program all athletes performed
by means of a Spirotiger® (MVM, Linate, MI, Italy), consisting of a
RMET for 20 min daily, seven days a week, for five weeks. They
hand-held unit with a pouch and a base station. A two-way piston
started RMET with the following average work load: volume of
valve connected to a rebreathing bag allows a constant isocapnic
the bag of 3.45 ± 0.37 l, respiratory rate 23 ± 1.4 b·min-1. At the
end-tidal CO fraction [24] to be maintained.
end of the training period the volume of the bag didn't change,
respiratory rate increased: 29.6 ± 2.1 b·min-1 (+28%, P<0.001)
The use of the instrument and the software, the assembly
corresponding to a ventilation of 102.5 ± 13.1 l·min-1, roughly the
of the various components and the hygiene standards were
same ventilation measured at RC point during incremental test
explained to the subjects.
(106.8 ± 0.3 l·min-1 and 98.2 ± 0.5 l·min-1 respectively for running
Before starting the protocol the subjects underwent four
and cycling).
supervised training sessions to learn the technique and to define
Maximal incremental tests
the appropriate size of the bag and the respiratory rate. While
performing the RMET, the athletes wore a nose clip to ensure that
During both cycling and running tests, the subjects in the
they were breathing through the training device only.
RMT group show a higher exercise capacity: wattage and speed
The volume of the bag was initially set at a value corresponding
to 60% of the subject's vital capacity. The RR was progressively
increased in order to reach the same ventilation measured at RC
point during the incremental test (roughly corresponding to 50%
of MVV). The subjects trained for 20 min daily, seven days a week,
The compliance to home-based training was evaluated by a
Subjects were required not to change their daily training and
diet during the study.
Statistical analysis
Data are reported as mean ± standard deviation (SD). The
unpaired T-test was used for comparison between RMT group
and CON group parameters at T0 and T1. The 2-way ANOVA test
was used to evaluate the effect of training on the anthropometric
parameters, pulmonary function, and ventilatory pattern and VO 2
trend during the tests; the P values were adjusted according to the
Bonferroni correction. Comparison between groups at different
points (after the warming up, at VT point, at RC point and at
maximum load) was performed by using repeated-measures
analysis of variance (mixed model). The parametric Pearson
correlation coefficient was used to describe the relationships
between variables: MIP vs VE and VE vs VO .
Statistical significance was accepted at P≤ 0.05.
All the analyses were performed using GraphPad Prism 40.
General characteristics of the subjects in the RMT and CON
groups are summarized in (Table 1). They had similar experience
in cycling and running and had similar VO peak at T0 (unpaired
T-test, P>0.05), (Table 1).
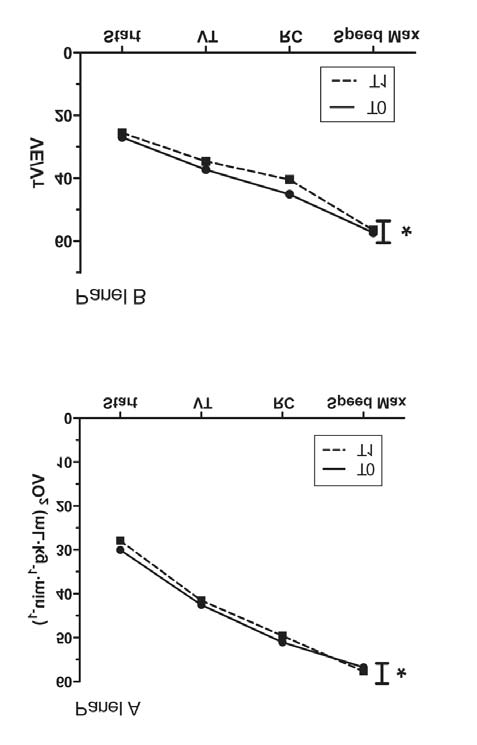
Figure 1 The oxygen consumption trend (VO2, Panel A) and
ventilatory pattern trend (VE/VT, Panel B) in RMT group during
Pulmonary function tests
running test before (T0) and after (T1) RMET.
* ANOVA test between T0 and T1, P<0.05.
No difference is found in FEV and FVC in both groups while in
Mean value after warming up (start), at ventilatory threshold (VT)
RMT group, but not in CON, a significant increase in MIP and MVV
point, at respiratory compensation point (RC) and at maximum load
is shown (P = 0.03, 2-way ANOVA); (Table 1). The comparison
reached at T0.
Ann Sports Med Res 1(1): 1003 (2014)
Bernardi et al. (2014)
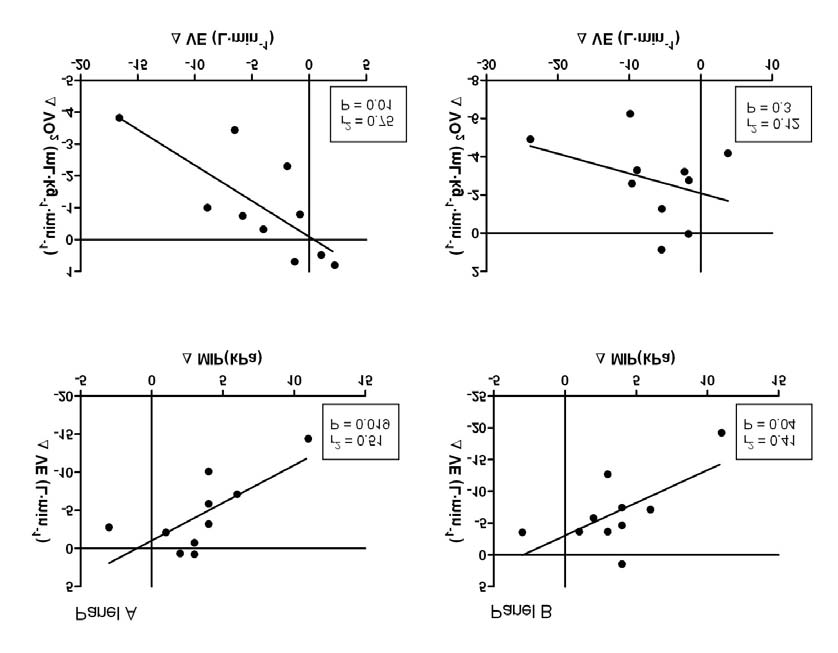
correlated with the changes in mean VO (r2 = 0.57, P = 0.01); no
similar correlation is observed in cycling (Figure 5).
The analysis of breathing pattern shows that VE/VT at T0
is significantly higher in running as compared to cycling. After
RMET, VE/VT significantly decreases in both tests maintaining
the differences between the two types of exercise.
As regards the VE/VO , at T0 there is a significant difference
between the two types of exercises, with cycling showing a better
ventilatory efficiency than running. After RMET, the efficiency
significantly improves in running but not in cycling and the
difference between the two exercises are cancelled (Table 2). No
difference in this parameter between T0 and T1 is observed in
the control group (Table 2).
DISCUSSION
The new important finding of this study is the change of
breathing pattern during exercise with the adoption of a slower
and deeper ventilation. This result is mainly due to the increased
strength and performance of respiratory muscle (significantly
higher MIP and MVV) as demonstrated by the strong correlation
between the reduced ventilation and the higher pressure
generated by respiratory muscle. These changes in turn affect the
maximal exercise capacity during running and cycling.
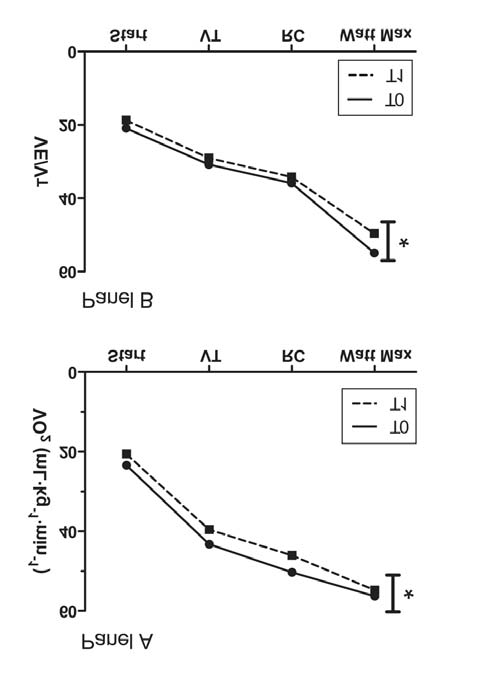
Figure 2 The oxygen consumption trend (VO2, Panel A) and
ventilatory pattern trend (VE/VT, Panel B) in RMT group during
cycling test before (T0) and after (T1) RMET.
* ANOVA test between T0 and T1, P<0.05. Mean value after warming
up (start), at ventilatory threshold (VT) point, at respiratory
compensation point (RC) and at the maximum load reached at T0.
significantly increase at the peak of exercise (Table 2) with no
changes in VT and RC points. The subjects in the CON group don't
show any significant change (Table 2). A significant difference in
maximum wattage and speed is found between the two groups at
T1 (unpaired T-test, P = 0.001).
During both tests we also analysed the VO trend and the
breathing pattern referring to four different points: after the
warming up, at VT point, at RC point and at maximum load
reached at T0. VO and VE/VT trends are significantly lower
after RMET in both tests in the RMT group (Figures 1,2) while in
the CON group no differences are observed (Figures. 3, 4). The
comparison between the groups shows a difference in VO and
VE/VT trends at T1 (P < 0.05).
The analysis of respiratory exchange ratio doesn't show any
difference before and after the training in any of the five points.
Data not reported.
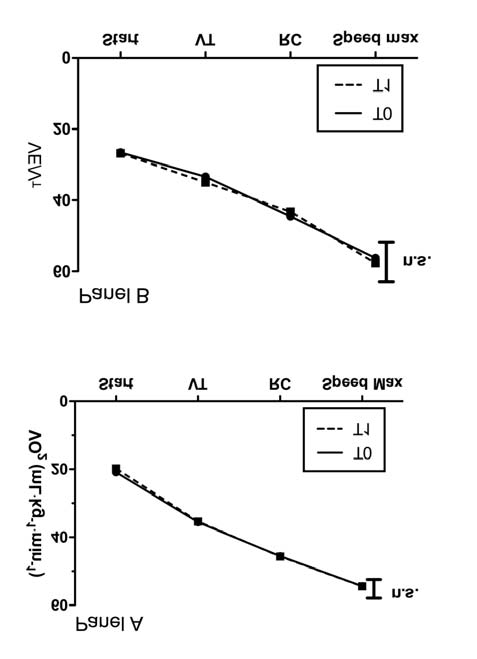
Figure 3 The oxygen consumption trend (VO2, Panel A) and
ventilatory pattern trend (VE/VT, Panel B) in CON group during
An inverse correlation is found in the RMT group between
running test before (T0) and after 5 weeks (T1).
changes in MIP and changes in mean VE for both tests (running:
ANOVA test between T0 and T1. Mean value after warming up (start),
r2 = 0.44, P = 0.03; cycling: r2 = 0.50, P = 0.02). Moreover, only
at ventilatory threshold (VT) point, at respiratory compensation point
(RC) and at maximum load reached at T0.
during the running test the changes in mean VE are significantly
Ann Sports Med Res 1(1): 1003 (2014)
Bernardi et al. (2014)
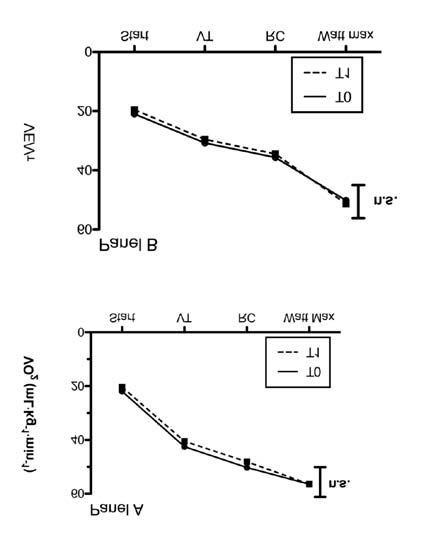
Figure 5 The oxygen consumption trend (VO2, Panel A) and ventilatory pattern trend (VE/VT, Panel B) in CON group during cycling test before (T0)
and after 5 weeks (T1).
ANOVA test between T0 and T1. Mean value after warming up (start), at ventilatory threshold (VT) point, at respiratory compensation point (RC)
and at the maximum load reached at T0.
Figure 5 Panel A running, panel B cycling. Upper panels: Correlation between the change in minute ventilation (ΔVE) and the change in maximal
inspiratory pressure (ΔMIP). Lower panels: correlation between the change in oxygen consumption (ΔVO2) and the change in minute ventilation
(ΔVE) before and after RMET.
Ann Sports Med Res 1(1): 1003 (2014)
Bernardi et al. (2014)
Table 2: Exercise performance during maximal incremental tests before and after training in RMT and CON group.
Load max (km·h-1)
17.8 ± 1.4§
Load at VT (km·h-1)
Load at RC (km·h-1)
VO peak (ml·kg-1·min-1)
HR max (bpm)
VE max (l·min-1)
RR max (b·min-1)
Load max (W)
395 ± 98§
Load at VT (W)
Load at RC (W)
VO peak (ml·kg-1·min-1)
HR max (bpm)
VE max (l·min-1)
RR max (b·min-1)
Data are represented as mean ± SD. * Statistical significance (ANOVA test) from T0 to T1, P<0.05. § Statistical significance (unpaired T-test) from T0 to
T1 between RMT group and CON group, P<0.05.
Abbreviations: RMT, respiratory muscle endurance training group; CON, control group; T0, baseline evaluation; T1, after five weeks. VT, ventilatory
threshold; RC, respiratory compensation point; HR max, maximum heart rate; VO peak, peak oxygen consumption; VE max, maximum ventilation; RR
max, maximum respiratory rate; VE/VO ventilatory equivalent of VO .
As regards VE/VT we observe a different response to exercise
of breathing and different breathing strategies during cycling and
between running and cycling. This is in line with the literature
running can play a role.
[17]. In fact, cycling and running are characterized by a different
In this study we also show that, after five weeks of RMET, the
breathing pattern, ventilatory efficiency and mode of increase
exercise capacity of amateur triathletes significantly improves
in ventilation. According to Kalsas and Thorsen [16], cycling
as demonstrated by the higher workload reached during both
is characterized by a steeper rise in VT and sharper curvature
incremental tests. Despite the increase in maximal workload,
of VE/VT, implying that VT max is achieved at a lower VE. Our
no difference in VO peak is found after RMET and this result is
results are similar to those reported in literature. At baseline we
consistent with previous data. As reported by Illi et al [7], only
found a different VE/VT during the two tests. RMET reduces the
in two studies out of 22 was a significant change in VO max
ventilatory response for identical exercise tasks and induces the
after RMET observed [12,24]. This could be due to the fact that
adoption of a more efficient breathing pattern characterized by a
RMET involves a small group of muscle (only respiratory) while
lower respiratory rate. This is true for both exercises: in fact, the
to improve the VO max a large group of muscle must be trained.
differences between running and cycling remain significant.
So, there should be no reason to observe a significant change in
As for VE/VO , at baseline we found a better ventilatory
the central cardiocirculatory response and O tissue utilization
efficiency in cycling (lower VE/VO ). After RMET, VE/VO
after RMET as pointed out by Markov et al [27]. Even if the VO2
significantly improves only in running, erasing the difference
peak does not change significantly, the VO trend during both
incremental tests shows a significant improvement. The less O
between the two types of exercises.
required to perform the same workload reflects the fact that an
Moreover, only in running is the reduction in ventilation
improvement in respiratory efficiency has been shown.
significantly related to the reduction in VO . We can therefore say
Interestingly, no change in both ventilatory threshold
that the effect of RMET in running is almost completely due to
and respiratory compensation point is found as if respiratory
the increase in strength and resistance of respiratory muscles, as
muscle training improves the ability to sustain exercise beyond
confirmed also by the strong correlation between the increase in
anaerobic threshold.
MIP and the reduction in ventilation.
This study has some limitations. The major limitation is the
This is not completely true for cycling. In fact, during this type
lack of either an endurance exhaustive constant-load test or time-
of exercise the reduction in ventilation is significantly related to
trials at different intensities; this is due to the fact that our aim
the increase in MIP but not with the lower VO . The explanation
was the evaluation of the effect of RMET on respiratory function
of this result can be only speculative. According to previous
and breathing pattern during maximal exercise tests. Another
papers [25,26], we might hypothesize that different entrainment
limitation is that the control group is not a placebo group:
Ann Sports Med Res 1(1): 1003 (2014)
Bernardi et al. (2014)
in fact they did not perform breathing exercise (i.e. a "sham"
In conclusion, respiratory muscle endurance training
increases respiratory muscle strength and changes the breathing
pattern during exercise toward a more efficient one characterized
by a lower respiratory rate. After the training the athletes can
tolerate a higher workload enhancing the exercise performance.
20. Trooster T, Gosselink R, Decramer M. Respiratory muscle assessment,
in: Gosselink R., Stam H., Lung function testing. European Respiratory
Monograph. 2005; 4, 57-71.
22. Conconi F, Borsetto C, Casoni I, Grazzi G, Guglielimni C, Manfredini F,
et al. The methodology of the "Conconi test". Oster J Sportmed. 1992;
Cite this article
Bernardi E, Melloni E, Mandolesi G, Uliari S, Grazzi G, et al. (2014) Respiratory Muscle Endurance Training Improves Breathing Pattern in Triathletes. Ann Sports
Med Res(1): 1003.
Ann Sports Med Res 1(1): 1003 (2014)
Source: http://sf-company.fi/pdf/RMET%20Triathletes.pdf
Available online at Anomalous self-experience and childhood trauma in Elisabeth Hauga,⁎, Merete Øiea,b, Ole A. Andreassen c, Unni Bratlien a, Barnaby Nelson d, Monica Aas c, Paul Møller e, Ingrid Melle c aDivision of Mental Health, Innlandet Hospital Trust, Ottestad, Norway bDepartment of Psychology, University of Oslo, Oslo, Norway cNORMENT, KG Jebsen Centre for Psychosis Research, Institute of Clinical Medicine, Division of Mental Health and Addiction, University of Oslo, and Oslo
The common diseases of goat, their symptoms, treatment, and methods used in Sindh-Pakistan. By Mrs. Farzana Panhwar, July 2005 Author: Farzana Panhwar (Mrs) Address: 157-C, Unit No.2, Latifabad, Hyderabad (Sindh), Pakistan [email protected]